
Documentation
Hi! I see you’re visiting from a mobile device. In order to get the best experience, please visit from a desktop.
About Process Mining
Process mining uses data to visualize how processes are performing in an objective and complete way. In an interactive manner, it supports its users to analyze how processes are running, including who did what, how long it took and when the process departed from the norm. This can be used to identify where performance or compliancy problems exist and which improvement initiatives are worth focusing on.
The main data source used for process mining is an event log. It contains information about who did what, at which time: an order is received on time X, the related product was delivered at time Y, and the payment made at time Z.
In the documentation of Lumigi, a lot of process mining terms are used. If you are new to process mining, it can therefore be a tough cookie. Luckily, there are lots of great resources on process mining available, like:
- The Process Mining Book by Fluxicon, which is a nice, practical guide;
- The Coursera Course on Process Mining by Wil van der Aalst, which gives a good, theoretical background. If you prefer to read, this book on process mining by the same author is recommended.
About Process Data Quality
Process mining is only a method. Its merits depend on the information captured in the event data. Finding and cleaning event data is complex, it’s messy, and it requires a lot of decisions impacting the rest of your process mining endeavor. Hence, validating that the output of the data preparation is correct, is important. Without early detection of process data quality issues, the results of the analysis can be misleading or even flat out wrong.
So how do you find data quality issues in event logs? If you’re like us, you assess the data as you move along in your process discovery, with a vague idea of what you expect based on experience. Not very efficient, and perhaps not very effective either.
With Lumigi, we set the first steps towards systematic data quality assessment in process mining. It outlines a structured approach to look at data quality, with easy-to-understand causes explanations. Feel free to use it if you want to:
- Find data quality issues fast, decreasing the risk of an unnecessary tedious and complex discovery phase and wrongfully drawn conclusions.
- Validate decisions made in the data preparation phase, like the selection of the case identifier or the level of detail of the activities.
- Learn about data quality issues you might not have thought of before.
Getting Started
Download
Lumigi is a freely available, standalone tool. Click here to get access.
Sample Data Set
The data set that is used as our running example throughout the documentation can be found here.
The data set is based on the data published for the BPI Challenge 2017 and modified to better showcase Lumigi. The data set was recorded at a Dutch financial institute and regards the application process for personal loans. Feel free to use it to try out Lumigi.
Set-up
When you start Lumigi, the first thing that you are asked to do is to select your dataset. This dataset should include at least the following three columns:
- The case identifier, referring to the object that you follow through the process;
- The activity name, referring to the step in the process that was executed;
- The timestamp, referring to when the activity was executed for the case.
If you have no event log yet, there’s a sample dataset you can download here.
Next step is to set the delimiter; the character specifying the boundary between the columns. In csv files, this is usually a comma or a semicolon.
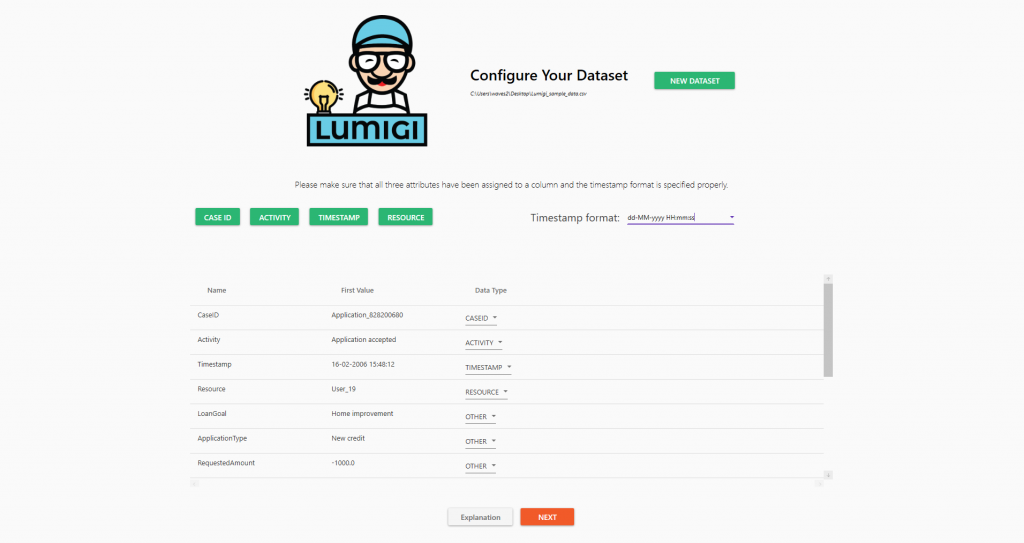
After clicking next, you can configure your dataset. Here, you specify which column contains the case identifier, the activity name and the timestamp. Optionally, you can specify the resource that executed the event. Lastly, it is required to specify the timestamp format. Select the appropriate timestamp format from the drop-down, or configure your own timestamp format using the legend below. Note that the timestamp formatting is case sensitive.
That’s it! Click next to start the analysis. This might take a while, depending on the size of your dataset.
| Character | Meaning |
| y | Year |
| M | Month |
| d | Day of the month |
| H | Hour (0-23) |
| m | Minute |
| s | Second |
| f | Millisecond |
Overview
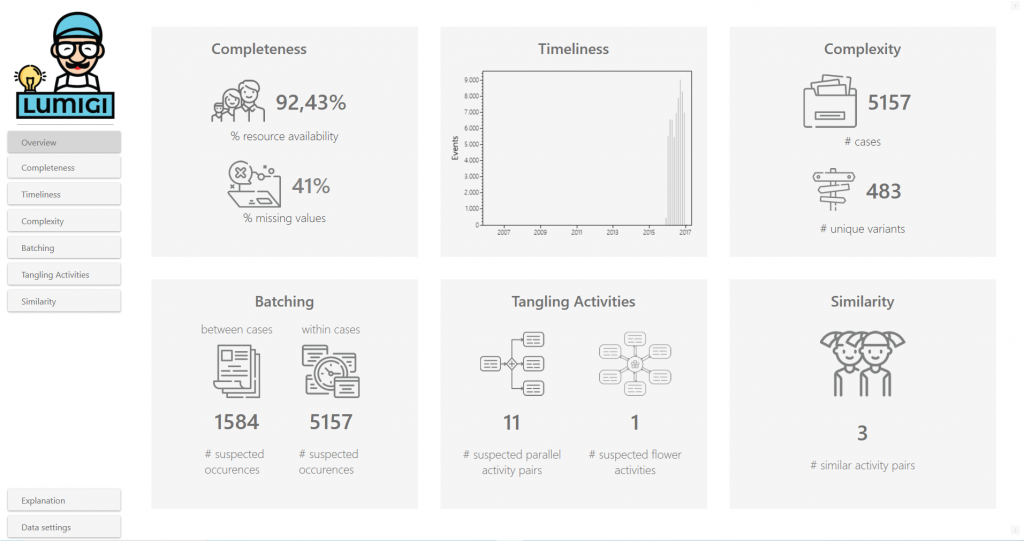
On the Overview page, you find a dashboard containing key metrics on the different ways Lumigi looks at process data quality. For each of these tabs, it is important to notice that none of the metrics are indisputable signs of data quality issues. They are designed to help you find possible data quality issues fast, but your domain knowledge is required to put the metrics into context.
Look at Completeness to get a first grasp of what data is in your event log; at first glance, do you have the necessary data for your process analysis?
Use the Timeliness screen to detect possible timestamp outliers. Is the event distribution in line with your expectation?
Once you have a first grasp of your data and assessed obvious timestamp outliers, with the Complexity tab, you can explore the structuredness of your data. This screen can help to identify incorrect start or end activities. Also, having an idea of the structuredness of your data can help interpret the other screens.
Look at Batching to identify events that happen on (almost) the same moment in time. Use your domain knowledge and our list of possible root causes to reflect on whether the batching is intended, or that there is an underlying data quality issue that manifests itself through batching behaviour.
Explore the Tangling Activities screens to identify activities that are suspects for tangles in your process graph, making your process discovery analysis more difficult.
Use the Similarity screen to search for synonymous activity names; do you have activity names that are spelled different, but mean the same thing?
Completeness
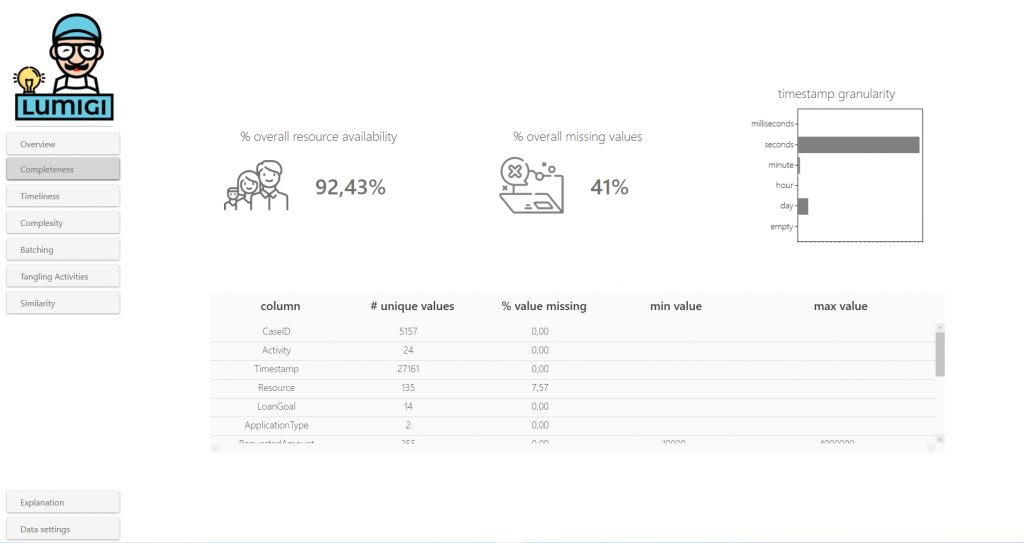
Here, you find different ways to explore whether you have the necessary data for your process analysis.
Resource availability
This metric shows the percentage of rows for which the column marked as ‘Resource’ is filled with a value. If it is known who or what executed each activity, this enables the analysis of the process from the resource perspective.
- With 100% resource availability, you are all set for the analysis from the resource perspective.
- With 0% resource availability, no analysis can be done from this perspective.
- For everything in between, explore where you miss resource data and whether it impacts your analysis; are resources available for the activities relevant for an analysis on segregation of duties or handover of work?
Example
In the sample data set, we see that resources are available for most – but not all – events. By looking at the event log, we can see that there are two activities for which there are never resources available. We could zoom in to the raw data sources to understand whether resource data could be added for these activities.
% overall missing values
This metric shows the fraction of the values that are empty. A high number indicates that your data may be incomplete. Use the detail table to understand in which column these empty values are present, to understand what the impact is on your analysis.
Example
In the sample data set, the % overall missing values is pretty high; 45%. Zooming in to the detail table, we observe that there are no values missing for the mandatory columns, but rather, for the attributes later in the data set. Interestingly, the number of values missing are exactly the same for most of these columns. By looking into the event log, we find that the columns that represent case attributes are only filled once for each case. This can easily be repaired.
Timestamp granularity
This chart shows the timestamps in your data grouped by the smallest time unit not equal to 0. For example, “13-04-2021 00:01:00” will be grouped to “minute”. Using this chart, you can assess the level of detail with which the activities are recorded.
Example 1: Low level of granularity

The chart above shows that all timestamps consist only of dates. In these situations, events with the same timestamp might in reality be executed in a particular order. This ordering is lost because of the timestamp granularity. To find events that occur for the same case on the same timestamp, please take a look at the within-case batching screen.
Example 2: Varying levels of granularity
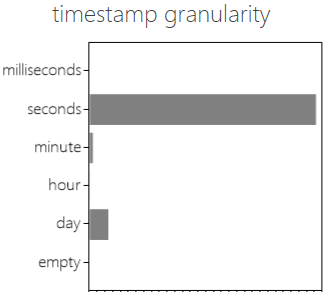
In the chart above, the level of granularity varies; the bars for “hour” and “day” are larger than one would expect by coincidence. Exploration of the event log learns that for the “Create application” activity, only the date is known, not the time.
Timeliness
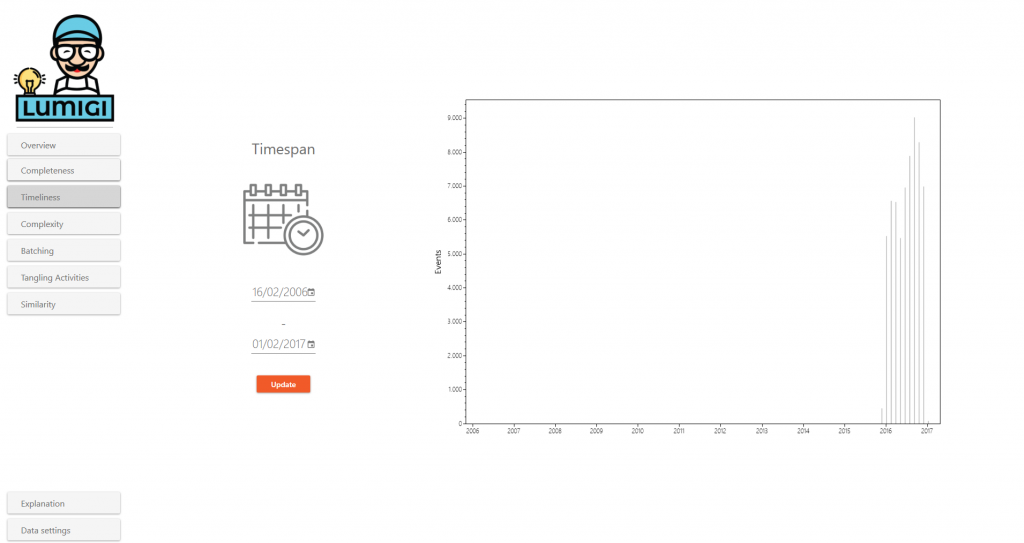
This screen shows the time frame that your data set spans. The event log timespan shows the first and last timestamp in your dataset. The graph shows the number of events over time. This can help you to identify outliers and supports reflection on whether the right time period is selected. Use these figures to:
- Assess how current the data is; was the data recorded a long time ago, or is the data very recent?
- Explore whether it spans the expected time frame; are the first and last timestamp as expected? If not, the early/late timestamps can be further inspected to find outliers.
- Observe how the events are distributed over time; an unexpected drop of the number of events may require further inspection to exclude data quality issues.
Example
In the sample data set, the event spans runs from 2006 to 2017, whereas almost all events are recorded between 2016 and 2017. Zooming in on the period 2006 – 2016, we see that events are recorded in 2006. Since there are so little of them, and the gap between their recording and the recording of all other activities is so big, these events are possible outliers.
To zoom in on a specific time interval, change the timespan and press “Update”.
The ideal time period for your analysis, depends on both your business question and the expected lead time of your process. If you are unsure whether you selected the right time span, here are a few rules of thumb that can help you on your way:
- Start small and expand the scope later: if it is the first analysis of the process, start with a very limited dataset. This prevents excessive computing times for transforming data and loading visualizations.
- Consider the expected lead time: if a case usually takes three months to be processed, a time span of a month is not enough to get a good view of the process. Consider using events that started in a particular month, or expanding the time span to a larger period.
- Considered the number of cases per time period: how many cases do you need for a proper analysis? If there are relatively little cases processed each time period, a larger time period might be interesting. Contrary, if a large volume of cases is processed each time period, a smaller time period might be sufficient.
- Reflect on your business question: if you are looking for improvement potential of the process, you might want to focus on how the process runs now rather than years back. If you are looking for duplicate payments that you can correct, a longer time period might be relevant.
Complexity
Complexity focuses on the level of structuredness of the data. Complexity is not necessarily a good or a bad thing; there usually exists a trade-off between the ease of analysis (lower complexity) and the level of detail of the analysis (higher complexity). The complexity screens give a quick insight in your event log, and give you starting points to explore data quality issues that possible cause part of this complexity.
Activities
Here, we focus on the activities to assess the level of complexity.
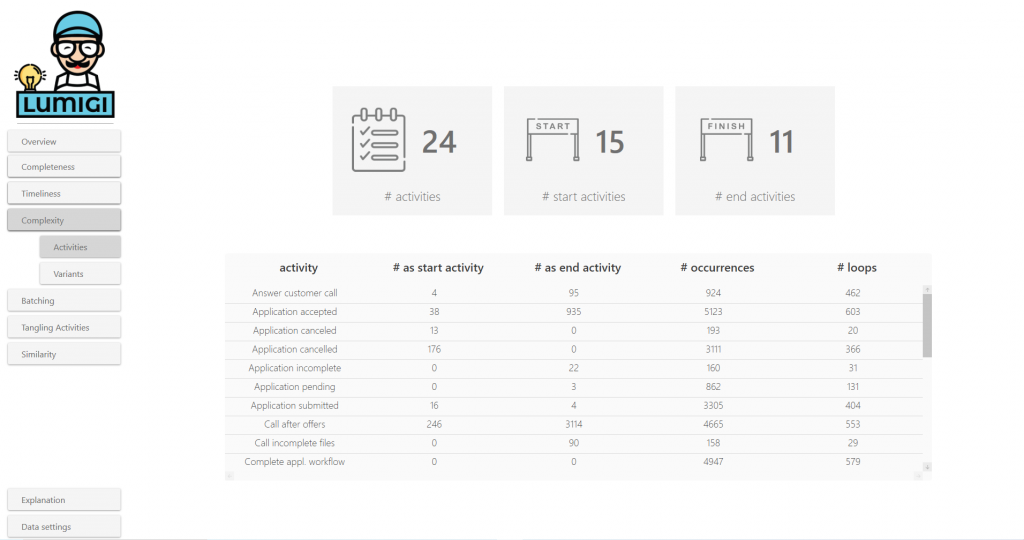
- # activities, # start activities and # end activities are a first indication of complexity, with higher values associated with a higher level of complexity.
- The activity table shows for each table the number of times it occurred as a start activity, as an end activity and the number of loops. Loops can be described as the number of times the activity was executed for at least the second time in the case. Use this table to find activities that are start/end activities unexpectedly, or find activities for which loops are present, whereas your domain knowledge tells you that the activity should only be executed once for each case.
Example
Both the number of start activities and the number of end activities are relatively large compared to the total number of activities. The detail table shows that “Application accepted” is noted as start activity in 38 cases, which is surprising; how can that activity occur before “Application created”? Furthermore, we would expect “Create application” to occur only once for each case, while loops occur relatively frequent.
Possible causes
If an activity has been logged as a start or end activity, while your domain knowledge suggests this is unlikely, this can have several explanations:
If the activity has been logged as an end activity, this can sometimes be explained by cases that are simply not finished yet.
This is the case when, in the data extraction process, only events are extracted that have been recorded within a specific time interval. This implies that starting events occurring before this time period, and the ending events occurring after this time period, are discarded.
This is the case when the start/end of the process is handled outside of the system that is analyzed. Instead, the start/end of the process is handled in another (legacy) system, or manually. If the former is the case, consider adding the event data from this system.
If somewhere in the process, a case is split up into multiple sub-cases, and for only one of the subcases, the first steps are included in the event log, this results in incorrect start activities for the other sub-cases. Similarly, if somewhere in the process, multiple cases are merged into one super-case, and for only one case, the last steps are included in the event log, this results in incorrect end activities for the other sub-cases. This frequently occurs in an issue-to-resolution process; when the same issue is reported multiple times, they are merged into one case.
If loops are frequently encountered, while your domain knowledge suggests this is unlikely:
If:
- You are analyzing a process containing multiple documents with many-to-many relations;
- The activity does not relate to the case document, but to a related document;
- There are multiple documents of that type related to the case document
This inevitably leads to loops. Consider, for example, a purchase-to-pay process in which you follow a purchase order. If the order is paid with partial payments, a loop on the payment activity can be expected. This does not mean that you paid for the full order twice, but from the process graph, it may seem like you do. Quite some blogs have already been focused on this topic. For more information, we recommend this blogpost by Fluxicon.
Possible effects
- Interpretation risk if activities are considered to be start or end activities when this is not the case, and when loops are the result of divergence.
- Missing important process insights, due to the noise in the data.
Variants
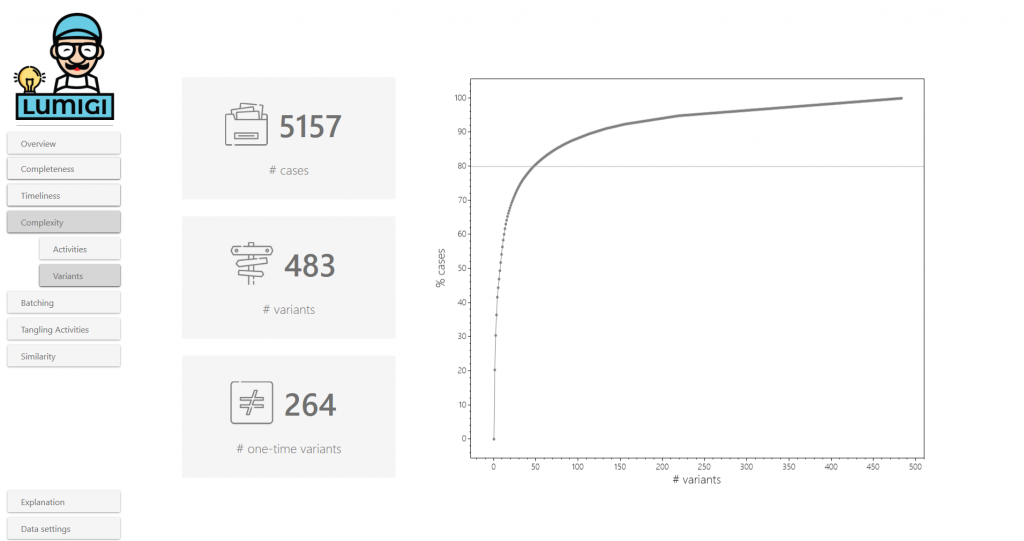
Here, we focus on the variants to assess the level of complexity. The number of variants indicates the number of different ways in which the process has been executed. To assess the complexity from the variant perspective quickly, you can use the 80/20 rule as a rule of thumb: how many variants are necessary to capture 80% of the cases?
Example
With approximately 30 variants, we cover 80% of the data in the sample data set. This seems to be a relatively structured process.
Possible causes
A high number of variants can be caused by a lot of different things. In the remaining screens of this tool, a high number of variants will be mentioned frequently as a possible effect of a detected pattern.Batching
With batching, we look at events that are recorded on (almost) the same moment in time. We distinguish batching between cases and within cases.
Between-case batching

Here, you find activities that were executed simultaneously for different cases. They can be found by grouping events that have the same activity name and the same timestamp. Finding batching behavior helps to better understand the data and the process, and may reveal underlying data quality issues.
Example
The activity “Application accepted” is frequently batched. This is plausible; batching occurs frequently in approval flows. Less plausible is that batching of the “Create application” is intended. In the Completeness screen, we signaled that the timestamp granularity of this activity was “date”; perhaps this batching is the result of imprecise timestamps?
Tip
By using the time difference indicator, you can explore not only activities that were recorded at exactly the same moment in time, but also activities that were executed within a relatively short timeframe.
Possible causes
A true positive! In reality, the activity was executed at the same moment in time for a bunch of cases. This batching behavior can be:
- System-driven; for example monthly payment runs, or production orders that are automatically triggered once a demand threshold is being met;
- Workforce-driven; when someone waits until the work ‘piles up’, for example to drive efficiency.
The latter is especially interesting; was this behavior considered in the design of the process, and does it actually improve productivity?
The timestamp indicates when the worker administered the activity, not when it was actually executed. Consider, for example, a sales agent that uses the Friday afternoon to process all his customer interactions of the past week.
There was no actual batching, but the timestamp recording is too imprecise to indicate the time in between the two events. If your timestamp only includes the date and not the time of execution, events that occur on different moments of the same date will seem to be batched.
The activity does not relate to the case document, but to a related document. This related document can be associated with multiple case documents. While, in reality, only one activity execution occurred, from the data it appears that multiple events were recorded at the same time. Consider, for example, a finance process in which we follow payments. In case of partial payments, several payment cases share the same timestamp for the ‘Create Purchase Order’. In reality, only one purchase order is created.
Possible effects
- Bottlenecks; the lead time until the activity is executed is relatively long or has a high variation, because an activity is only executed periodically or when a certain threshold is met.
- Flower activities; the activity can occur right before and right after a large number of other activities, as execution depends on the time until the next batch run or the length of the queue. Of course, this effect only occurs if the activity is executed in parallel to other process steps.
- Interpretation risk, if the batching was not intended, but it is found to be.
- Missing important process insights, due to the noise in the data.
Related perspectives
- The timestamp granularity chart on the completeness tab
- The Flower activities tab
Within-case batching
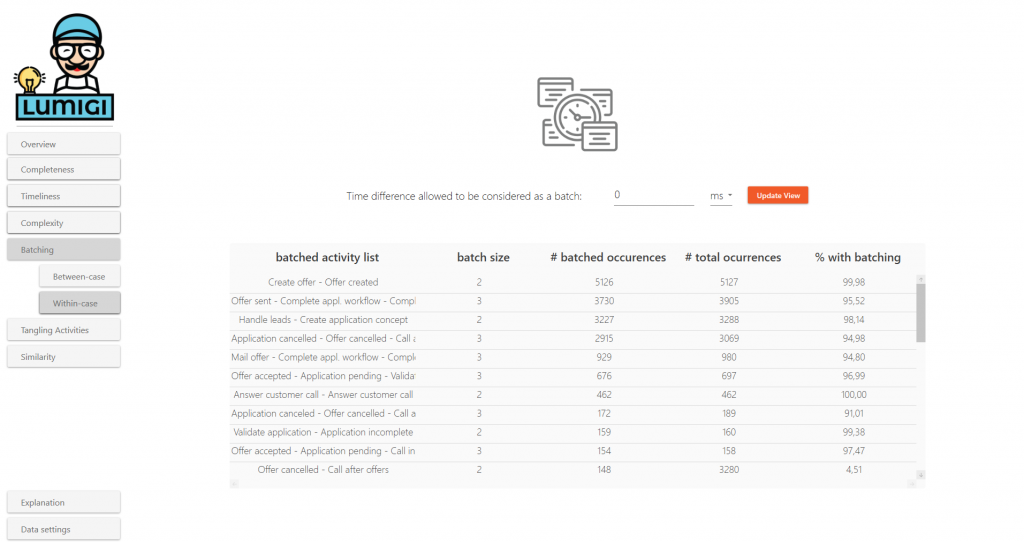
Here, you find activities that are executed at (almost) the same timestamp for the same case. They can be found by grouping events that have the same case identifier and the same timestamp. If activities are consistently executed simultaneously, this can be an indication that the level of detail of your activities is too low, or that the event timestamps do not accurately reflect the moment of execution.
Example
The activities “Create offer” and “Offer created” always occur on the same timestamp. Since they mean the same thing, one of the activities can possibly be removed from the log without information loss.
Tip
By using the time difference indicator, you can explore not only activities that were recorded at exactly the same moment in time, but also activities that were executed within a relatively short timeframe.Possible causes
Here, multiple activities are captured from the same electronic form. Users click a ‘Save’ button in the form, at which point all activities captured by the form are associated with the timestamp of saving the form, instead of with the timestamp at which the activity was actually executed.
Here, there are multiple different events that essentially refer to the execution of just one process step. If this occurs, you might consider to cluster them in your event log. Collateral events can have several root causes:
- Highly-detailed activities: the system records the activities on a much higher level of detail than what’s necessary for your analysis;
- Automatically triggered system activities: one event triggers one or more system activities;
- Duplicated activity recording: when an event log is created from multiple systems, it can occur that multiple systems record the same process step.
This is the case when the timestamp indicates when the worker administered the activity, not when it was actually executed. This occurs often when the system does not allow steps to be skipped, forcing the user to quickly run through multiple statuses in quick succession.
There was no actual batching, but the timestamp recording is too imprecise to indicate the time in between the two events. If your timestamp only includes the date and not the time of execution, events that occur on different moments of the same date will seem to be batched. To assess your timestamp granularity, take a look at the Timestamp granularity chart on the Completeness tab.
Possible effects
- High number of activities, whereas that might not be necessary for an insightful analysis.
- High number of variants, which is associated with the high number of activities, but also depends on how your process mining software sorts events that are executed simultaneously for the same case; are they sorted alphabetically, is another attribute responsible for the sort order or is the order in which the events occur in the event log leading? In case of the latter, this can be another cause of the high number of variants and thus noise in the process graph.
- Interpretation risk if the event timestamps do not reflect the actual moment of execution (in case of form-based event recording, administrative batching, or imprecise timestamps).
- Missing important process insights, due to the noise in the data.
Related perspectives
- The Complexity tab
- The Timestamp granularity chart on the Completeness tab
Tangling Activities
With tangling activities, we look at activities that are likely to create tangles in your process graph. You can use this knowledge by excluding tangling activities in the first stage of your analysis, in order to structure your process graph.
Flower Activities

Here, you find activities that have a lot of activities happening directly prior to and directly after the activity. If you zoom in to such an activity in a (directly-follows) process graph, this part of the graph resembles a flower, where the activity in question is the center, and a petal is formed for each other activity and the arcs going to and from it. To assess this, a custom ‘flower score’ is computed for each activity, and the activities are shown that exceed the threshold of 0.8. Flower activities are likely to make your analysis more difficult, as they are accompanied by a high number of variants and create tangles in your process graph.
Example
The activity “Answer customer call” has a high flower score. This makes sense, as it is a likely boundary activity.
Tip
For flower activities, it is likely that it is a parallel suspect with a lot of other activities. In the Parallel Suspects screen, you may want to focus on activity pairs that do not include a flower activity.
Possible causes
When this is the case, the flower activity is not part of the core process, but is triggered externally. Consider, for example, the activity ‘Answer customer call’ within a customer service process; the customer can call in every stage of the process. It could be an interesting signal of in which stage of the process customers get so dissatisfied that they reach out, but you might want to exclude the activity if you want to get a grasp of the core process.
The flower activity is part of the core process, but it runs in parallel with a lot of other activities. Directly-follow process graphs don’t handle these more complex cases of parallelism very well, so you might want to explore other visualizations that support parallelism better.
The flower activity occurs in various stages of the process, but its interpretation depends on the stage of the process it occurs. Consider, for example, a ‘Correspondence’ activity, which in one occurrence may refer to sending a quote, whereas in another occurrence, it may refer to scheduling a meeting. When dealing with an ambiguous activity name, often, the activity also has a lot of loops. You can check whether an activity is frequently looped in the Complexity tab.
If you observe a lot of flower activities, you might be dealing with a very complex event log and you have what they call a ‘spaghetti’ process. Your process analysis might be more challenging, but the potential benefits are substantial.
Possible effects
- High number of variants, since there are a lot of unique ways in which the activities can be executed. This results in lots of tangles in your process model.
- Missing important process insights, due to the noise in the data.
Related perspectives
- The Parallel suspects tab
- The Complexity tab
Parallel Suspects

Here, pairs of activities are shown that are likely to run in parallel; in some cases, activity a occurs before activity b, whereas in others, activity b occurs before activity a. For this, we identify all activity pairs that have occurred in both temporal orders (‘a before b’ and ‘b before a’), and count how often each temporal order occurs; the smaller the gap between the frequency of each temporal order, the more we suspect parallelism. Parallelism is likely to make your analysis more difficult, as it is accompanied by a high number of variants and creates unnecessary tangles in your process graph.
If one activity is parallel to a lot of other activities, this might be a flower activity. Check the Flower activities screen for more information.
By default, this screen shows the activity pairs sorted ascending on the ‘% a – > b’ column. Clicking on this column will sort the pairs in descending order. This way, you can explore pairs in which activity a is almost always executed before activity b. If your domain knowledge tells you that activity a should always happen before activity b, this opens the door for further data analysis on the cases that do not comply to this rule; did activity b actually occur before activity a (hinting to a compliancy issue), or was the timestamp for activity b wrongly recorded?
Possible causes
An obvious cause for parallel suspects is, well, that the activities are executed in parallel; in reality, it does not matter in which order the activities are executed, as long as they are both executed at a certain stage in the process. Consider, for example, a loan application process, in which both creditability and collateral need to be checked; the order in which the checks are executed, does not matter, as long as they are both performed before the application is approved.
If one activity is a parallel activity with a lot of other activities, it might be a boundary activity; the activity is not part of the core process, but is triggered externally. Consider, for example, the activity ‘Register customer call’ within a customer service process. A customer can call in every stage of the process, but it might be an interesting signal for analysis in which stage of the process customers get so dissatisfied that they get on the horn. For a boundary activity, it is also expected that it has a high flower score (see the Flower Activities tab).
If all activity pairs are probable parallel suspects, the complexity of your log is high and you have a ‘spaghetti’ process. Your process analysis might be more challenging, but the potential benefits are substantial. If this is the case, it is expected that there are also a lot of flower activities found (see the Flower Activities tab).
Possible effects
- High number of variants, since there are a lot of unique ways in which the activities can be executed. This results in lots of tangles in your process model.
- Missing important process insights, due to the noise in the data.
Related perspectives
- Flower Activities tab
- Complexity tab
Similarity

Here, you find activities that have different names but share some similarities:
- At the top, activity pairs are shown that are similar in the position they hold in the process graph; the activities occurring right before and right after them, are similar.
- At the bottom, activity pairs are shown whose names are very similar; only a few characters in the activity names are different.
Exploring similar activity names helps you to assess whether your log contains activity names that describe the same step in the process. If this is the case, merging these activity names could simplify your analysis, without resulting in a big information loss.
Example
For the sample dataset, we identify a misspelling of ‘Application cancelled’ in the string similarity table.
Possible causes
When the event log is created using multiple data sources, it could be that in two data sources, the same activity is recorded under a slightly different activity name.
When the activity name is entered manually, a typo is easily made, resulting in a new activity name.
Possible effects
- High number of activities, whereas that might not be necessary for an insightful analysis.
- Missing important process insights, due to the noise in the data.
Learn More
Additional Resources
More and more research becomes available on process data quality. Do you want to learn more on this topic? We recommend to keep an eye on the website http://www.processdataquality.com. Also, the open-source tool PreaclarusPDQ is under development by the BPM group of Queensland University of Technology. When the tool is operational, we will provide a link to it here.
Justification
Lumigi is built using state-of-the-art research, combined with experience from practice. The main sources of information are the articles Event log imperfection patterns for process mining towards a systematic approach to cleaning event logs by Suriadi et al, and Towards Event Log Querying for Data Quality by Andrews et al. The articles describe 11 event log imperfection patterns, 6 of which can be detected with Lumigi.
| Pattern | Implemented |
| Form-Based Event Capture | Yes; Within-case Batching with parameter set to 0 ms. |
| Inadvertent Time Travel | Yes; Parallel Suspects with the column ‘% a -> b’ in descending order (see tip 2). |
| Collateral Events | Yes; Within-case Batching with parameter set to a small time interval. |
| Scattered Event | No |
| Unanchored Event | No |
| Elusive Case | No |
| Scattered Case | No |
| Synonymous Labels | Yes; the graph similarity section on the Similarity screen. |
| Homonymous Label | Yes; Flower Activities that have loops (for # loops, see the Complexity screen). |
| Distorted Label | Yes; the graph similarity section on the Similarity screen. |
| Polluted Label | No |
Open Opportunities
Not only are we the first process mining tool focused on data quality, we are also the first to keep a list of known flaws of our tool. We think that a tool that aspires to bring more transparency, should be transparent itself. Also, Lumigi is a first attempt to raise awareness about process data quality. We know it’s not flawless, but we hope Lumigi gets the conversation started. With this list, we hope to keep it going.
Do you have something to add to this list? Drop us a message at hello@lumigi.nl!
General Opportunities
Here, we keep a list of the general opportunities for improvement that we have learned from our users:
Lumigi does not allow you (yet) to drill down. Frequently, you need to open up the raw data in a different tool to understand which events are related to the patterns found with Lumigi.
Lumigi shows the occurrences of different patterns, but has no scoring mechanism to help understand how well an event log performs on each pattern. Incorporating this would help users to focus on the things that matter most.
There is no way a user can mark an occurrence of a pattern as “non-relevant”. If this was possible, a user could go through al the screens in detail once. Later, if they use Lumigi on a slightly altered event log, they could easily zoom in to the changes in the pattern occurrences.
An opportunity to guide the user in focusing on the most relevant pattern occurrences, is by adding questions during the configuration on where certain behavior is expected, and where not. With knowledge of the expectations, attention can be drawn to pattern occurrences that deviate from the expectation.
Lumigi only detects, it does not support repairing the event log. By suggesting the right repair functions on the different pattern detection screens, repairing the log could be simplified.
Currently, we only support one timestamp column per event. Including, for example, both start- and end timestamps, may help to better find data quality issues.
Technical Opportunities
Here, we keep a list of the more technical opportunities for improvement that we have learned from our users:
With a large number of variants, the processing time of Lumigi becomes relatively long. This could be improved.
For batching, only the case identifier, timestamp and activity names are considered; the resource is not taken into account.
For example, consider the example below with the time difference allowed to be considered as a batch to be 2 minutes. The batched sequence for Application_1 will be “Offer cancelled – Call after offers”, whereas the batched sequence for Application_2 will be “Call after offers – Offer cancelled”.
| CaseID | Activity | Timestamp |
|---|---|---|
| Application_1 | Offer cancelled | 01/02/2016 15:50 |
| Application_1 | Call after offers | 01/02/2016 15:51 |
| Application_2 | Call after offers | 07/02/2016 08:45 |
| Application_2 | Offer cancelled | 07/02/2016 08:46 |
Both methods that Lumigi uses for similarity detection cause a lot of false positives. For graph similarity, activities with opposite meaning can have a similar position in the process graph. For example, “Accept Offer” and “Reject Offer” will have similar preceding activity. The string similarity is also not without flaws; “Create PO” and “Create PR” are only different by one character, but creating a purchase order is clearly different from creating a purchase requisition. Probably a better method to assess similarity is by taking a look at a broader context, as proposed in A Contextual Approach to Detecting Synonymous and Polluted Activity Labels in Process Event Logs by Sadeghianasl et al.